Share
This article initially appeared in The State of Open Humanitarian Data 2026.
Over the past several years, the HDX team has worked to broaden access to climate data in order to support anticipatory action and impact assessments for weather-related hazards in humanitarian operations. While this data is often shared publicly by providers ranging from universities to the private sector, it can be difficult to find and use given barriers to discoverability, complex file formats and the limited accessibility of technical documentation.
In 2022, we started to include climate data in the HDX Data Grids. We began with a sub-category for climate impact data, which includes current and historical impacts of climate events on people, infrastructure and vegetation. In 2025, we expanded this coverage to include data on hazards, such as droughts, floods and storms. These datasets, along with forecasts, are essential for the advanced analysis involved in predicting crises and defining triggers for anticipatory action frameworks.
Although there are over a dozen climate data providers on HDX, three organizations in particular contribute to the Data Grid climate category: the Joint Research Centre of the European Commission, JANUS Atmospheric and Environmental Research, and the Climate Hazards Center. These organizations bring scientific and technical expertise that complements humanitarian knowledge.
The Joint Research Centre of the European Commission has shared their global Anomaly Hotspots of Agricultural Production (ASAP) dataset on HDX since December 2023. ASAP is an operational early warning system that tracks hotspots of agricultural production anomalies across crop and rangeland areas. The agricultural hotspots analysis for 80 countries is updated monthly, whereas the underlying indicators are updated every 10 days. ASAP blends satellite data with agro-climatic indicators to flag emerging drought, vegetation stress, and production risks. Its hotspot alerts support food security monitoring and crisis anticipation, giving humanitarian analysts an early signal when agricultural seasons are deteriorating.
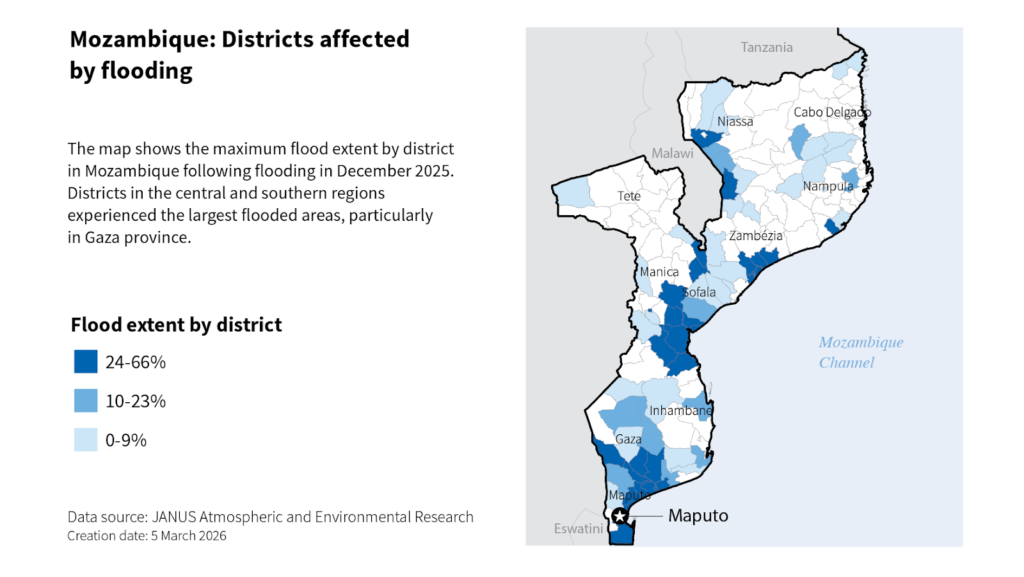 The JANUS Research Group has shared their FloodScan: Near Real-Time and Historical Flood Mapping dataset on HDX since March 2024. FloodScan delivers global flood extent mapping using passive microwave satellite data, allowing responders to monitor floods even under cloud cover. Updated daily, FloodScan provides one of the most consistent, high-frequency flood monitoring products available. By making their lower resolution dataset covering Africa publicly available on HDX, they provide humanitarian teams with early visibility on the scale, location, and progression of flood events.
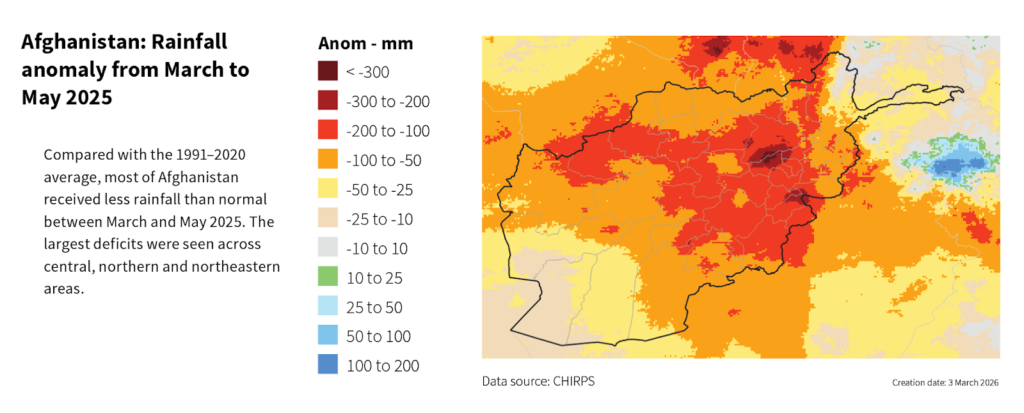 The UC Santa Barbara Climate Hazards Center has produced the CHIRPS dataset since 2015. CHIRPS was designed for agroclimatological monitoring in food insecure areas to support drought monitoring by the Famine Early Warning Systems Network. The dataset combines satellite and station data to provide gridded quasi-global precipitation estimates at regular timesteps. A new version of CHIRPS, version 3, became available in 2025. It includes more station data and covers 60°N to 60°S and all longitudes.
WFP processes the CHIRPS rainfall data for 129 countries, aggregating it for each administrative region and calculating long-term averages and anomalies. This processing makes the data easier to analyze and interpret. WFP has shared this data on HDX since 2023.
These datasets have improved the ability for humanitarians and a wider set of partners to understand and respond to climate-related crises. A powerful example of this comes from Sauti East Africa, an NGO based in Kenya, that uses HDX to access FloodScan and CHIRPS datasets, among others, and translates this data into short, simple text messages that are used by farmers and traders to plan migration, conserve water or seek aid during droughts.
The following dataset characteristics have proved to be particularly valuable for analysis and decision support:
- High-update frequency: The update frequency of these datasets ensure humanitarians can effectively monitor rapidly changing climate conditions. The satellites used by FloodScan cover most of the earth twice a day, resulting in up to four daily observations and allowing for humanitarians to detect changes in flooding in near real-time. Both ASAP and CHIRPS increase the speed at which humanitarians can identify emerging food security risks, with ASAP identifying agricultural anomalies through detailed warning updates every ten days and CHIRPS providing preliminary rainfall estimates every five days.
- Broad geographic coverage: Providing global data in a standardized format enables analysis pipelines to be more easily scaled, allowing humanitarians to consistently analyze climate conditions across geographies. This broad geographic coverage also facilitates types of analysis that would not otherwise be feasible. For example, where traditional flood impact assessments are often local, using high-resolution imagery to capture the footprint of a flood event, the near-global coverage of the FloodScan dataset informs regional patterns and trends.
- Availability of historical data: With historical data, analysts can create benchmarks against which to measure new shocks and predict future ones. CHIRPS provides access to historical data from 1981 to present, FloodScan from 1998 to present, and ASAP from 2000 to present. This historical data allows for the creation of reliable seasonal and monthly averages and ensures humanitarians can understand the relative severity of emerging climate shocks and their potential impact.
- Locally calibrated: The value of these datasets is in their ability to effectively capture local conditions. For example, the CHIRPS datasets integrate satellite estimates with tens of thousands of station observations each month, capturing local variations in rainfall. This combination ensures CHIRPS data can be calibrated and fine-tuned, achieving a greater accuracy than either data source could provide alone. The ASAP dataset combines satellite data with local contextual information, such as the presence of crops and their phases of active growth. This integration of contextual analysis, within a global standard format, provides humanitarians with a more sophisticated understanding of likely impacts on agricultural production. FloodScan uses local historical statistics and seasonal change tracking to continuously predict dry-land conditions. Localized dry-land models allow FloodScan to adapt to changes in vegetation and soil moisture states, optimizing flood detection accuracy given the latest satellite observations.
Each dataset is produced by a trusted partner with an established history of providing high-quality datasets with clear humanitarian applications. We are grateful to the Joint Research Centre of the European Commission, JANUS Research Group and the UC Santa Barbara Climate Hazards Center for making their data publicly available on HDX. By doing so, they bring their immense expertise to humanitarian efforts.