Share
As part of the Centre’s work on strategic foresight, we have been exploring the future of humanitarian data across a number of domains. Through desk research and expert interviews, we surfaced 43 ‘drivers of change’, spanning technological, economic, environmental, political, legal and humanitarian-specific trends. With our partners, we have interrogated the importance of and connection between these drivers, and identified patterns of change and what it may mean for humanitarian response. During this process, the use of novel data sources in the humanitarian sector emerged as a key area for exploration.
Novel data sources can be defined as data that is not initially produced for humanitarian response but can improve our situational awareness. Over the last decade, humanitarians have been testing and piloting the use of such data sources, yet uncertainty remains about where, when and how they are best deployed, and the role they should play alongside data collected by humanitarian organisations.
Examples of Novel Data Sources
| Data source | Use case example |
| Satellite-derived imagery | World Vision’s use of Meta’s high resolution population density maps to visualise the location of existing water supply services. |
| Call detail records | Flowminder’s use of anonymised call detail records from mobile network operators to provide estimates of population mobility and distribution. |
| Social media | Nowcasting Populations’ monitoring tool for population displacement in Ukraine, utilising Facebook’s marketing API. |
| Crowd-sourcing | Humanitarian OpenStreetMap Team’s creation of a pre-conflict dataset of all building footprints in Gaza, with remote, online volunteers enhancing data accuracy and completeness. |
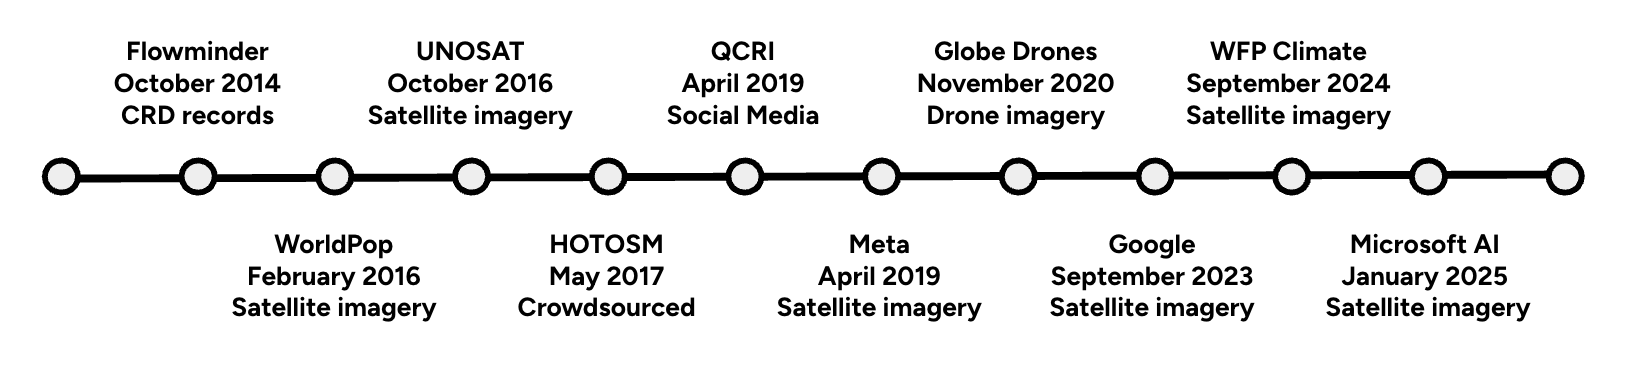
The increased use of this data for humanitarian response can be tracked through the Humanitarian Data Exchange (HDX) platform. The first dataset from a novel source was shared on HDX in October 2014: a call detail record-derived dataset from Flowminder. Since then, partners have shared data on HDX that is derived from satellites, drones, social media and crowd-sourcing.
Organisations Sharing Novel Data Sources on HDX (2014-2025)
 Domain Exploration
Novel data sources can provide important proxies in data-limited contexts. When combined with traditional humanitarian data, such as needs assessments or displacement tracking, these sources can increase the resilience of the humanitarian data ecosystem. For example, in response to the March 2025 Myanmar earthquake, Microsoft AI for Good Lab provided data on building damage before access to affected areas was possible. In other cases, Meta’s high-resolution population density maps have been used to estimate the number of people living within a 30-metre grid and their demographics, helping organisations identify people in need.
Applications of this novel data sources have been explored through many pilots over the last decade. However, progress has not been linear. Seemingly promising technologies have fallen into obscurity, while others have carved out clear use cases. How should humanitarians use novel data sources to reinforce informational resilience, rather than create new dependencies?
Exploring this question required a structured rubric through which we could assess the integration of novel data sources to date, understand their technosocial context, and consider the factors that may define their future use in the humanitarian sector. We used two tools to do this: the S-Curve and the Technology Axis Model.
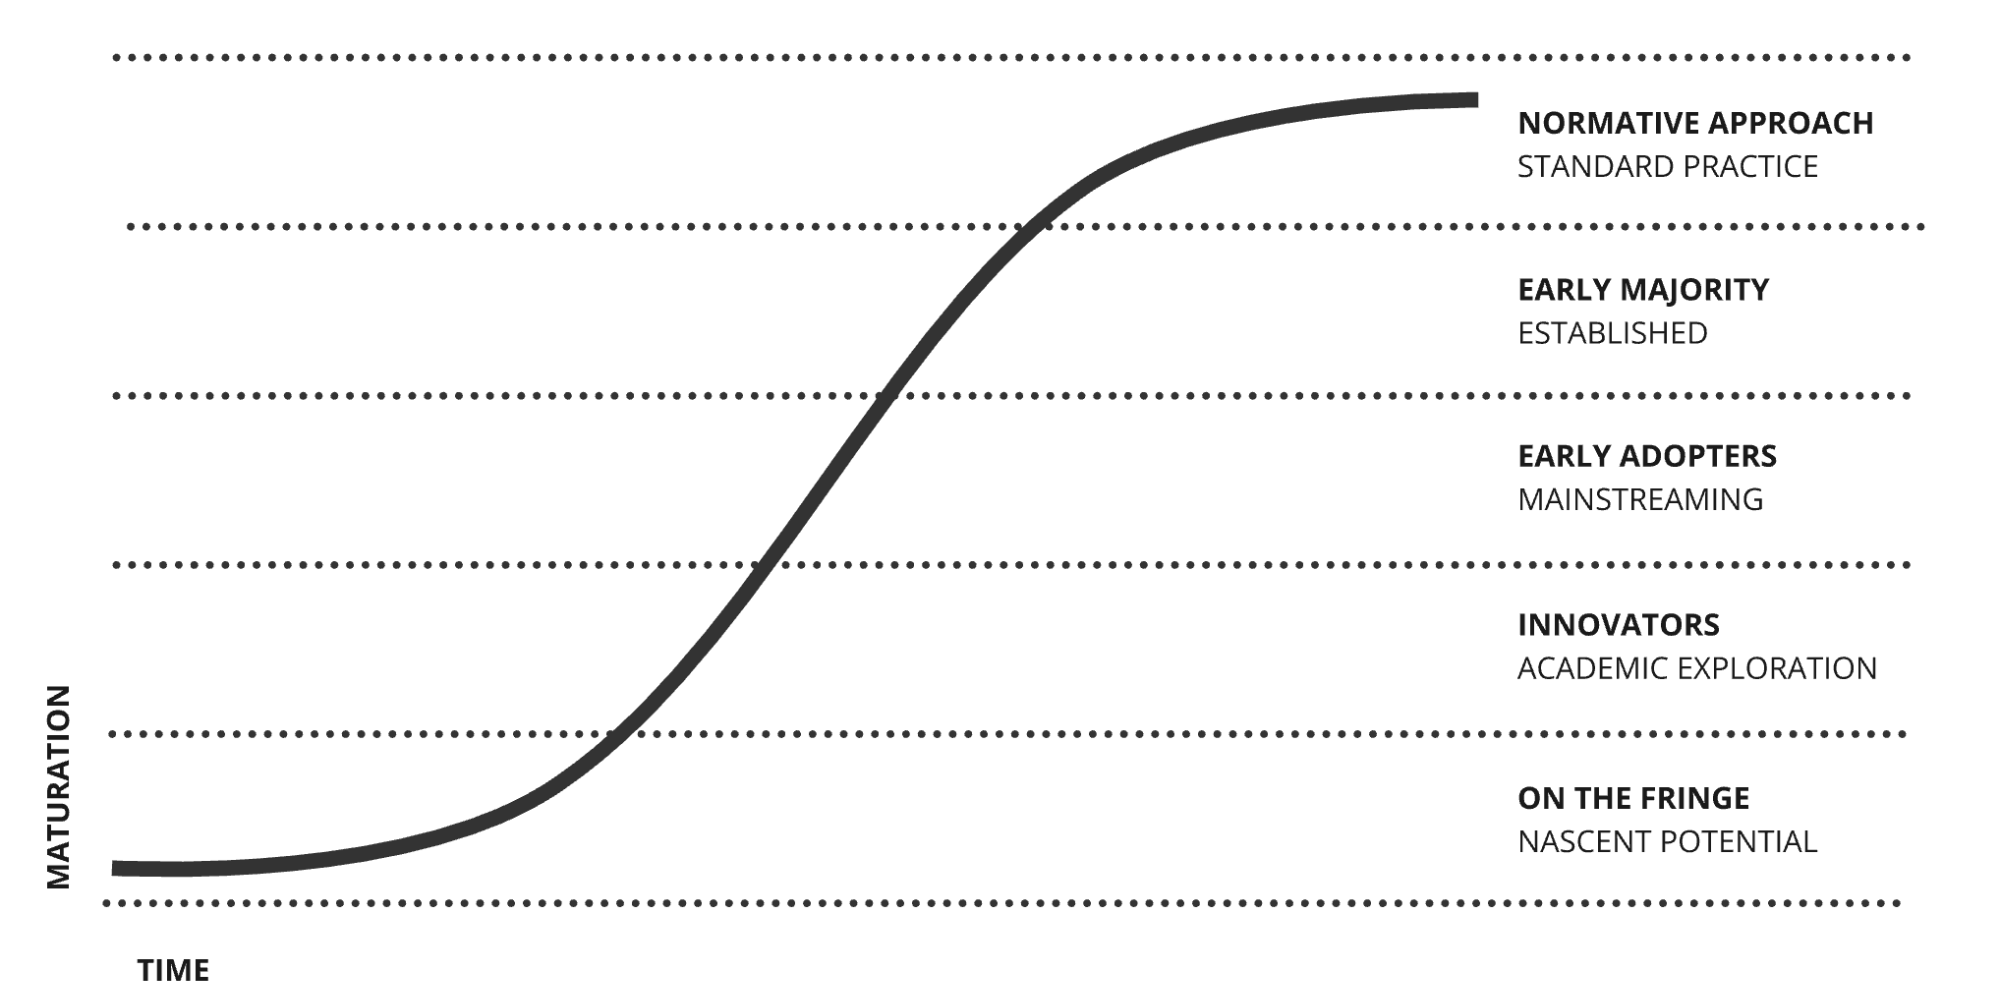
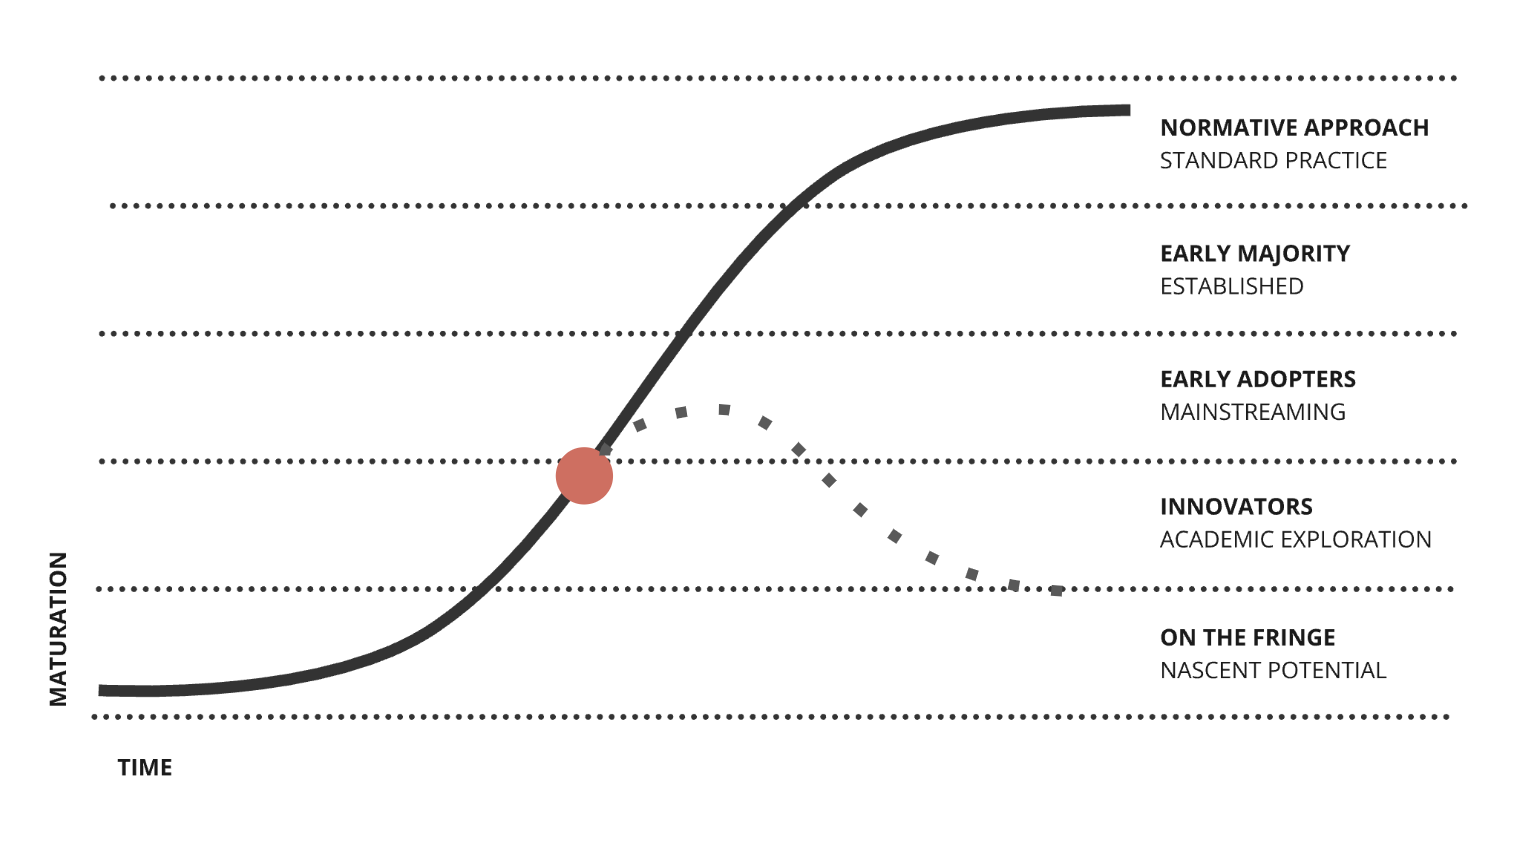
The S-Curve
The humanitarian sector’s adoption of novel data sources can be mapped against an S-Curve (adapted from Fisher, 1971), which measures maturity from nascent potential to normative practice. For example, the use of satellite data to create dynamic, high-resolution population estimates has moved from a ‘nascent’ opportunity towards a common practice, proving particularly valuable in contexts with limited or outdated census data. The S-Curve creates a way to plot examples of where novel data sources have been integrated into crisis response analysis or appear trapped in a perpetual pilot phase.
The Technology Axis Model (TAM) positions technology innovation cycles as happening in four inter-linked areas:
- The development of the underlying technology.
- The social norms and values associated with the innovation and its effects.
- The applications that are emerging as entrepreneurs seek to introduce the technology into markets.
- The infrastructure and systems that govern the technology area.
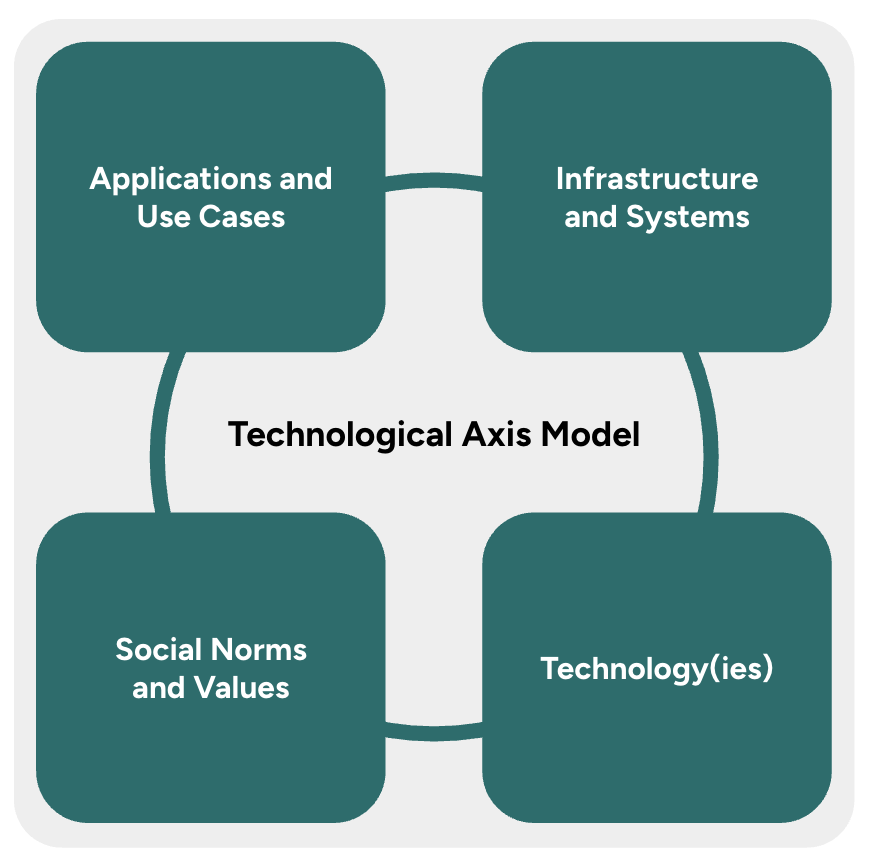
The Technology Axis Model was originally developed by Bill Sharpe as a way to help engineers think more widely about the contexts that surround technology innovation. Our definitions are drawn from a forthcoming paper on the Technology Axis Model, by Bill Sharpe and Andrew Curry.
An underlying assumption of the TAM is that “applications do not always succeed.” As David Edgerton says, “most innovations are never used; many innovations fail.” The reasons for innovation failure span the model’s elements, from incompatible values to unsustainable business models or insufficient appetite. Given the rate of innovation failure across sectors, and the significant financial pressure facing the humanitarian system, proactively investigating the coherence of a technology within its context is important and useful.
Returning to the example of satellite-derived population estimates used with the S-Curve, its successful integration into the sector’s analysis can be understood through TAM’s four elements.
- Technology: The underlying technology, satellites, provide dependable, high-resolution imagery.
- Infrastructure and systems: The data produced through this methodology can be shared and accessed publicly. Understanding population is critical to multiple sectors, not just to humanitarians, making its continued production more likely over time. This data is always needed.
- Applications and use cases: The application for population estimates provides clear value for humanitarians, particularly in contexts without a recent census. It provides a baseline indicator that is fundamental to humanitarian response.
- Social norms and values: The methodology for estimating population has a strong academic basis, resulting in trusted outputs. Norms exist around using satellite data.
By reviewing these four elements, we can see the Technology Axis has stabilised for satellite-derived population data.
Case Study: Facebook Social Media Data and Ukraine
Using the S-Curve and TAM provided a codified process to assess the usefulness of Facebook’s advertising API data as an input into population estimates in Ukraine, and to surface broader learnings when using social media data for subnational population estimates. This case study reflects the work of the Leverhulme Centre for Demographic Science and partners, with quotations from the paper: ‘Nowcasting Daily Population Displacement in Ukraine through Social Media Advertising Data’.
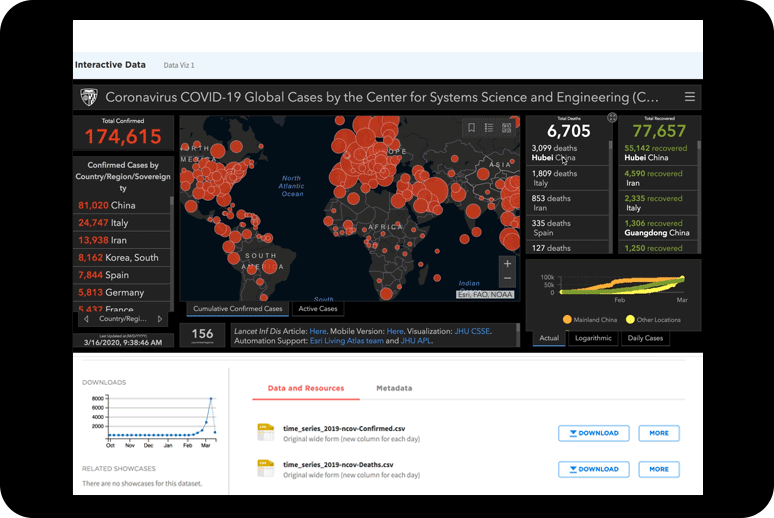
For context, in the immediate aftermath of Russia’s 2022 invasion of Ukraine, information was scarce on the ‘locations and demographics of displaced people inside Ukraine’. Alternative sources of information were critical. This nowcasting project created a real-time monitoring system to estimate subnational population sizes every day disaggregated by age and sex, derived from Facebook marketing API. This data was triangulated with other sources including International Organisations for Migration’s (IOM) telephone surveys to build confidence in IDP estimates. The result was population displacement estimates at a ‘finer geographical, temporal, and spatial resolution, thus complimenting other population datasets’. The evidence from these complementary approaches resulted in the UN’s decision to significantly revise official estimates of internally-displaced persons (IDPs) from about 1.6 million to 6.48 million in mid-March (IOM, 2022).
S-Curve Assessment
Our assessment is that the utilisation of social media data for displacement currently sits in ‘academic exploration’ of the S-Curve. The Ukraine NOWPOP project proved a clear ‘proof-of-concept of how digital trace data can be leveraged in combination with population data to build real-time monitoring systems for rapid targeted assistance for vulnerable populations displaced by a crisis’.
However, for this data source to integrate, stable access to social media data that can be extrapolated to reflect the broader population is necessary. It is important to recognise that the context in Ukraine differs from many other humanitarian crises, due to the sophistication of communication infrastructure and the relatively high socioeconomic status of its population. If this data is not similarly available and representative in other humanitarian contexts, this application may return towards ‘the fringe’ of the S-Curve.
Using the four elements of the TAM, we can understand what may accelerate or stall the integration of a data source into humanitarian response.
For this case study, the technology we are assessing is the data source: Facebook’s marketing API. Integrating this data source into the monitoring system allowed for the estimation of displacement at a ‘finer geographical, temporal, and spatial resolution’. This approach created an information cadence that was not previously available. When viewed from a technological lens, the advantages of this data source are clear.
When looking at applications, we can ask, what are the emerging applications proposed, or required, by individuals, academics, organisations and governments? This case study demonstrates a clear application for this data source in supporting displacement estimation in regions that retain levels of internet connectivity and have high-levels of mobile phone penetration. This approach proves the ‘value of novel data for nowcasting’ for humanitarian use, as it provided the ‘only data-driven population estimates available at the time’. However, extrapolation from social media users may not provide a representative sample, and may ‘exclude potentially vulnerable subpopulations who do not have mobile phones or internet access’.
For infrastructure and systems, we ask: what systems, infrastructure and business models are necessary to enable the technology to be deployed? For example, within this case study, achieving real-time dynamic measurement required data from non-humanitarian actors. The data was available exclusively through Facebook’s marketing API. The lack of clarity on the ‘data cleaning and model-based estimation that Facebook implements to generate these data… results in some degree of quality uncertainty, random noise, and potentially unknown biases’. The ability for humanitarians to integrate this type of data depends on tolerance for third-party intermediation.
For social norms and values, we ask: what social values, norms and expectations shape this area? How are they translated into regulation? What conflicts are emerging? For example, considering social norms for this case study raises questions about the potential risks of aggregating this information. There may be potential harms created by ‘mapping vulnerable populations in near real-time with a fine-grained spatial resolution’. Humanitarians will need to navigate these issues of aggregation when deploying social media data at scale.
This case study demonstrates the ability of social media data to ‘nowcast’ displacement in highly dynamic conflict settings. The more comprehensive TAM process raised a number of provocations when considering the integration of social media data into the sector, including:
- What level of methodological complexity can the humanitarian sector manage? How do we balance the desire to integrate data from multiple inputs against the need for our processes to be explicable to the wider humanitarian community?
- How can humanitarians manage the quality uncertainty and unknown biases that come when using data that has been processed by a third party?
- Where can novel methods, e.g. social media data analysis, sit alongside traditional approaches, e.g. telephone surveys, allowing for a rapid assessment of the reliability of estimates? Where can combined methodologies be used to increase sector trust in estimates?
Whats Next
We are keen to develop further case studies to build a system-wide understanding of the successes and failures of novel data sources to date. If your team has undertaken work that could form the basis of a case study, please reach out to kate.hodkinson@un.org. We are interested in case studies spanning satellite-derived data, social media data, call detail records, GPS data, and crowd-sourced data.